Most Indian Reserves Hide Their Tigers. Why Tadoba Can't.
Tadoba's tiger density is a fraction of Corbett's, yet sighting rates rank among India's highest. The gap between those facts is the real story.

Archana Bhagat Schäfer
Published 22 June 2026 · 5 min read
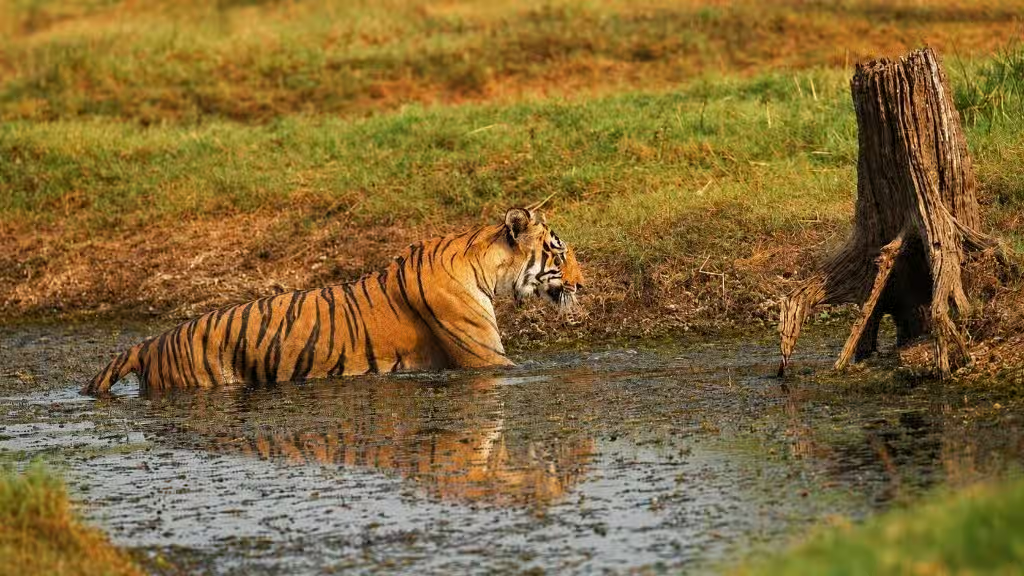
Half past six at Telia Lake, one of the great lakes at the heart of Tadoba. A tigress is walking along the opposite bank. The forest is open around her. There is no tall grass to hide her and no crowd of jeeps around the water. For a visitor, it is a very good place to see a tiger.
If you choose a park by its tiger count, you might not choose Tadoba.
The number that would send you elsewhere
Tadoba has around 95 adult tigers. Its density is about 7.18 tigers for every 100 square kilometres.
That sounds good until you compare it with other reserves. Bandipur, in Karnataka, records 19.83 tigers per 100 square kilometres. Corbett, in Uttarakhand, records 19.56. Kaziranga, in Assam, records 18.65. These figures are useful for understanding the broad picture, but they are not a league table. They do not tell you how easy a tiger will be to see.
Tadoba still produces sightings with remarkable regularity. In nearly a decade of hosting guests here, we have yet to meet anyone who did three drives and saw nothing. We cannot promise that result to anyone. We can say that the number of tigers in a reserve is not enough to predict the experience of a visitor.
Why more tigers can mean fewer sightings
Tiger numbers depend partly on how much food a forest can provide. Corbett's river plains and Kaziranga's grasslands are exceptionally productive. They can support many tigers.
They can also hide them. A tiger in three-metre-high grass may be only forty metres away and still impossible to see. The same thing happens in thick forest. A high tiger count tells you that the habitat is good for tigers. It does not tell you that the habitat is good for watching them.
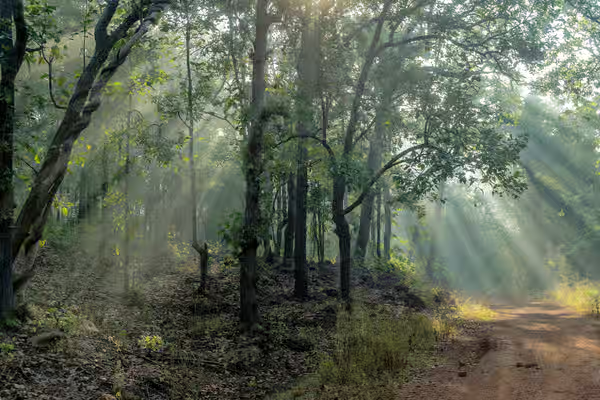
Tadoba is different. It is a dry teak and bamboo forest. In the hotter months, the leaves and undergrowth thin out. Water becomes scarce, so animals gather at a smaller number of lakes and waterholes. The forest becomes easier to read. A tiger crossing the track has fewer places to disappear.
That is why Tadoba can offer better sightings than its density figure suggests. The advantage comes from the shape of the forest, not from having the highest number of tigers in India. The India Tiger Parks pages explain how this changes from one reserve to another.
What this means for your safari
Season is part of it. October to February brings cooler mornings and comfortable drives. March to June is much hotter, but the shrinking water supply brings animals together. April and May usually offer the strongest conditions for tiger sightings. They are also the hardest months to sit in an open jeep. Choose the trade-off knowingly.
Gate choice matters as well. Tadoba has many gates, and the most famous one is not always the best choice for your dates. A quieter gate near a reliable water source can produce a better morning than a busy gate with a stronger reputation.
The number of vehicles matters when something is found. A sighting shared with four jeeps feels very different from one shared with twenty. Tadoba's gate limits help keep the pressure manageable. This is one reason to ask where you will actually be going, rather than booking the reserve by name alone.
Do not assume that the core zone is always better than the buffer. The core is the protected inner forest. The buffer is the surrounding forest where people and wildlife live closer together. Tigers use both. The buffers can be quieter and remain open throughout the rainy season. We explain the choice in Core or Buffer Zone? What We Tell Our Guests.
For the same reason, give yourself more than one drive. Even a good park can produce an empty morning. More drives give the forest time to work in your favour, and Tadoba's many gates give your safari more than one possible route. The story of how this forest recovered, and why tigers now use the buffer as well as the core, is on our Tadoba page.
No park on earth guarantees a tiger, including Tadoba. But a readable forest, the right season, a sensible gate and several drives can change your chances. That is the useful lesson behind the density number.
Planning a Tadoba safari?
Where you sleep and where you safari are the same decision. Tell us your dates and we plan both halves together: room and forest, confirmed before you arrive. Start the Conversation →
More Interesting Reads
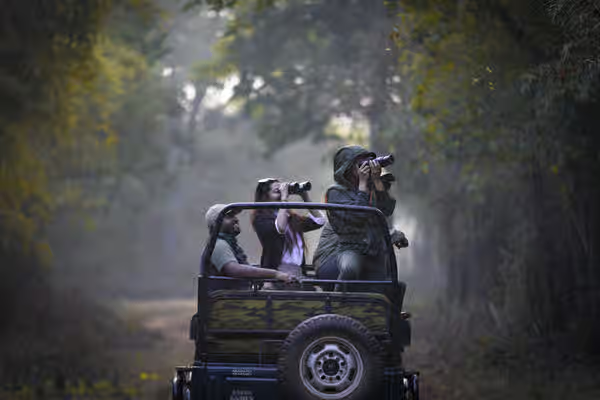
Where to See Tigers in India: Why We Picked These 16 Parks
Where are you most likely to see a real tiger in the wild? Sixteen parks matter for that question. How we chose them, and why Tadoba is the measure.
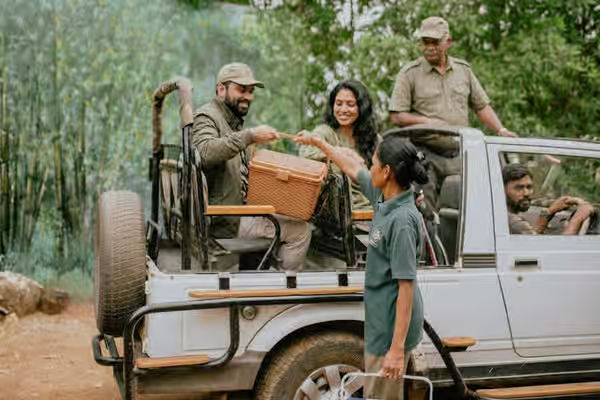
Core or Buffer Zone? What We Tell Our Guests
The hierarchy of core over buffer is one of the most persistent myths in Indian safari planning. Here is what actually matters.
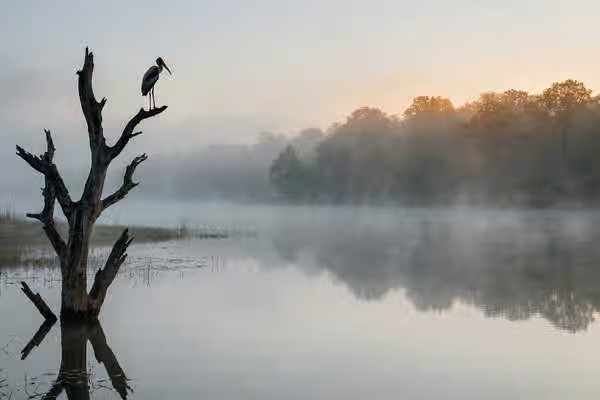
The Birding Safari at Tadoba: Why It Deserves a Trip of Its Own
Over 280 documented species in an IBA-designated forest, and mornings with nothing to do with tigers. Central India's most overlooked wildlife experience.
Tadoba Safari Gates: Where You Stay Changes Everything
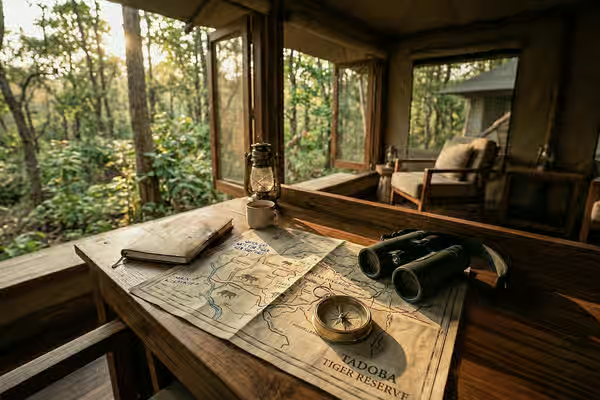
Tadoba is larger than Greater London, yet most resorts sit by one gate. Where you stay decides your alarm, your drive, and what a 3-hour safari costs.
Tuning In: Why You Should Read Tadoba With Your Ears
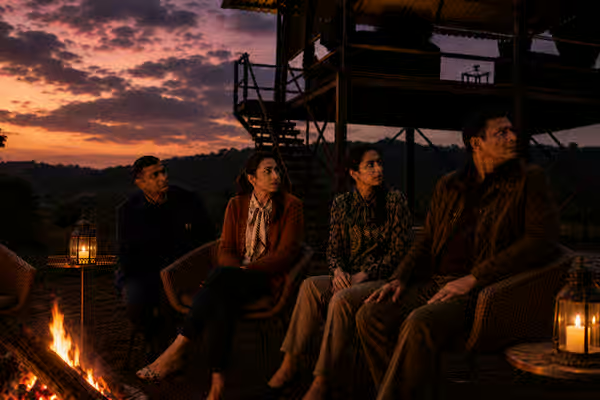
Most guests arrive waiting to see the wildlife. The real secret is learning how to listen to it, especially after dark.
Two Full Bathrooms in Every Room? Why It Matters
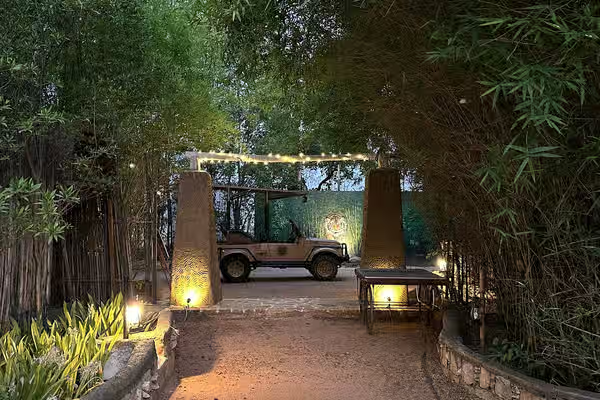
Nobody should queue at 5am while the jeep waits outside. Why details like two full bathrooms matter, learned the hard way.
Tadoba's Climate Has Three Engines, Only One Is Warming
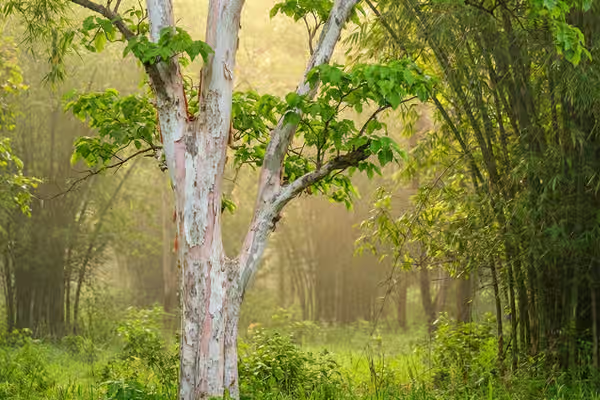
Why Tadoba's records look gentle while the planet warms. Fifty years of weather, half lived and half projected, and what El Niño does and does not decide.
Services & Guides
Five safari types bookable with Limban right now - headache free. Take your pick.
Jeep, canter and full-day routes across every gate, arranged end to end by our own team.
Your Tadoba Guide: History, Climate, Zones, Wildlife, Best Time to Visit and Handy Tips
Everything worth knowing about the reserve, kept current season by season by the Limban team.
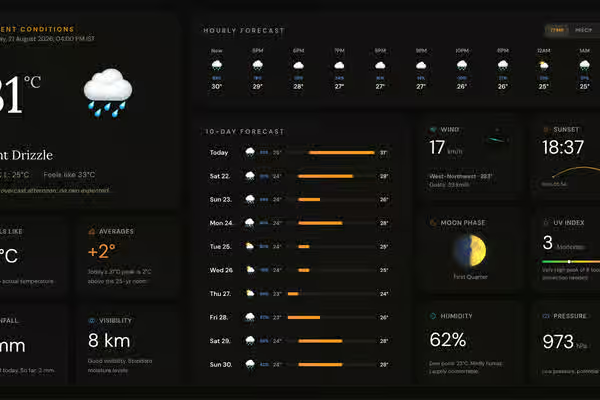
Live Weather Conditions, Accurate and Up-to-date 10-day Forecast for the Moharli Corridor.
Hourly forecasts, a ten-day outlook and safari-condition readouts, refreshed through the day.