Tadoba's Climate Has Three Engines, Only One Is Warming
Why Tadoba's records look gentle while the planet warms. Fifty years of weather, half lived and half projected, and what El Niño does and does not decide.

Mark Schäfer
Published 9 September 2026 · 7 min read
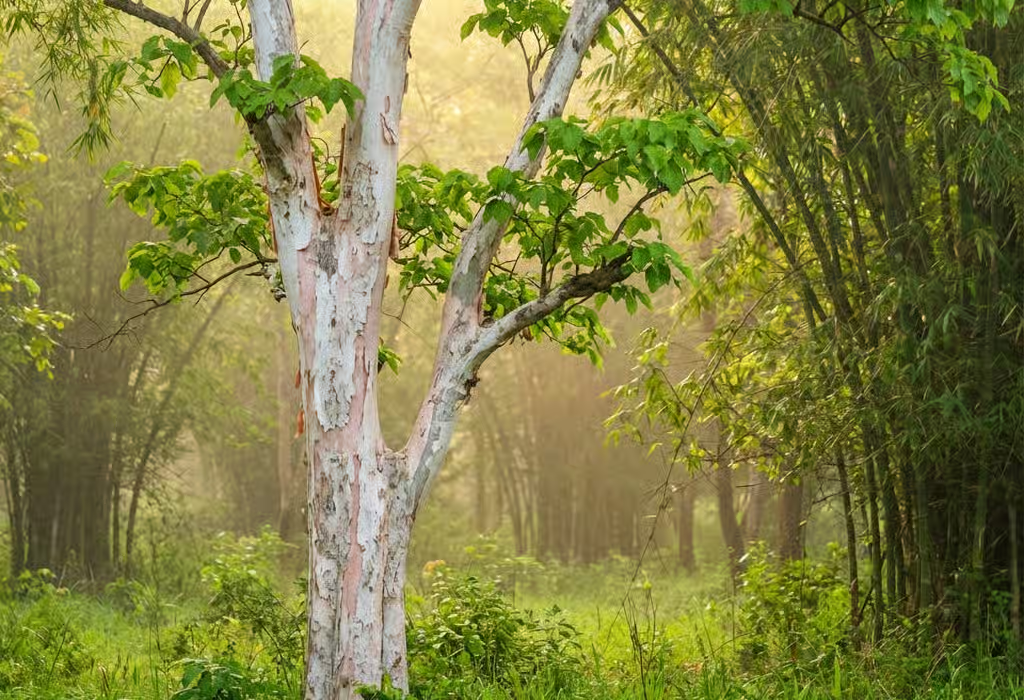
If the planet is warming, Tadoba's recent record does not look like it.
The first thing that stops you in the record is not the warming. It is the missing heat signal.
Rain is up. The series averages about 1,304 millimetres a year, but the first five years managed just over 1,100 and the last five came close to 1,500.
Furnace days are down. Days above 42°C averaged around 22 a year in the early 2000s, and 4 a year in the most recent five.
The average daytime high has barely moved: around 32.6°C across the whole run.
Taken at face value, this is a forest that got wetter and gentler while the world warmed. It is not a contradiction so much as three distinct climate engines running at once over this landscape: global greenhouse forcing, an atmospheric shield of aerosols and clouds, and the chaotic oceanic rhythms of the Pacific and Indian oceans. Only the first is warming. The other two have, over this period, appeared to push surface temperatures downward.
This post pulls those three engines apart, using twenty-five years of ERA5-Land reanalysis and four modelled projection windows through 2050 for one coordinate in the Moharli landscape. The full numbers sit on our climate page.
Engine one: the background is still warming
Greenhouse gases are the least mysterious part of the story. They warm India. Rainfall is less settled. A 2024 IIT Bombay study found that aerosols helped suppress the Indian warming signal before 2000, while greenhouse-gas influence became more dominant afterwards. It also linked that change in dominance to a revival in monsoon rainfall.
That is the broad background, not a complete explanation for Tadoba. The seven-model ensemble behind our projections is much clearer about heat than rain: all seven point towards warmer conditions through the projection windows. The awkward question is why the local historical series barely shows that warming. Something else was running at the same time.
Engine two: the atmospheric shield of dust and cloud
Air pollution and cloud cover form the second engine: an atmospheric shield that reflects sunlight and alters precipitation. Over central India, aerosols from industry and seasonal biomass burning have long been associated with muted surface warming and suppressed monsoon rainfall.
The IIT Bombay paper describes a national shift where greenhouse gases began overtaking aerosols. Yet locally, Tadoba's recent five years (2021–2025) saw days above 42°C plummet to just four a year, while rainfall averaged close to 1,500 millimetres—including back-to-back soakings above 1,800 millimetres in 2022 and 2024.
Cloud is where this reaches the skin. By day, heavy cloud cools the surface by scattering incoming solar radiation; at night, it traps warmth. In 2022, researchers at IIT Delhi found that net cloud radiative forcing suppressed seasonal warming trends in some Indian regions and accelerated them in others. When a cluster of unusually wet, cloud-covered years arrives, the combined evaporative cooling and cloud shading acts as a temporary brake on extreme surface heat, masking the warming trend running beneath it.
Engine three: the ocean years refuse to behave
Annual rainfall is where tidy explanations start to fail.
The old rule of thumb says El Niño tilts India towards drought. It is a useful tendency, not a rulebook. The Pacific is only one of the things the monsoon is listening to, as the ENSO and Indian Ocean records make clear.
2015 belonged to one of the strongest El Niño events on record, although much of that event's peak came after the monsoon. Tadoba still received a fairly ordinary 1,253 millimetres. In 2023, El Niño was developing through the monsoon and became strong later in the year. Tadoba received 1,352.
2019 was a weak, fading El Niño year, yet it produced the second-wettest year on file here at 1,744 millimetres, alongside the record 44 furnace days.
2011 was a La Niña year, though the signal was not strong through the whole monsoon season. Tadoba's rainfall that year was 853 millimetres, the driest in the series.
The wettest year, 2013 at 2,155 millimetres, was classed as ENSO-neutral by operational standards. Neutral does not mean nothing was happening in the Pacific. It means there was no sustained El Niño or La Niña event to carry the explanation.
The Indian Ocean can tilt the odds too. A positive Indian Ocean Dipole, with warmer water in the western Indian Ocean and cooler water in the east, can support the Indian monsoon while a warm Pacific is working against it. The positive IOD in 2023 probably helped offset some of El Niño's influence. Calling it the sole rescuer is too neat. A single year's rain is no verdict on the climate.
Every time an El Niño builds across the equatorial Pacific, seasonal forecasts arrive with brisk confidence about what it will mean for the coming Indian monsoon.
Here is what twenty-five years of local data say against that confidence. An El Niño shifts the statistical odds of a weak monsoon, and forecasters can put a number on that shift. It does not write Tadoba's rainfall total. By the time rain reaches Moharli, the Pacific, the Indian Ocean Dipole and a dozen convective afternoons are all tangled together.
A December Pacific forecast will be revised three times before the rains break. The forest pools in April will not have been. That is the reading we trust.
Heat is the clearer projection
The models are more decisive about heat than rain. By the late 2040s, the annual mean maximum moves from 32.6°C to about 34.1°C, and the minimum from 22.6°C to about 24.2°C. The change concentrates in summer: June days are close to two and a half degrees higher, and June nights nearly three degrees warmer. These are mean values across the full series; the climate page shows the full range of daily extremes — roughly 21–33°C today to 24.5–35°C by 2050 — which tells a compatible but broader story.
The recent mild summers look, on this evidence, more like a reprieve than a new normal. Our projection data reaches 2050, so this is a mid-century warning, not a late-century forecast.
Read the furnace-day projections for direction rather than as an absolute count. Historical ERA5 records register discrete daily temperature peaks at a single surface coordinate, whereas CMIP6 projection downscaling aggregates probabilistic exceedance across multi-model grid envelopes, naturally smoothing extreme daily tails. The direction, however, is consistent across all seven models: the later projection windows push the frequency of days above 42°C sharply upwards. Tadoba recorded 44 such days in 2019. The worrying possibility is not that every year becomes 2019, but that summers like it stop being exceptional.
Rain is where we should be modest. Projected annual totals stay mostly inside what this forest has already lived through, between the 853-millimetre year and the 2,155-millimetre year. There is no firm drying claim here.
What does keep appearing in the projections is a change in the calendar. In the late 2040s, August is about 124 millimetres lighter and July about 65 lighter, while October is roughly 30 millimetres wetter. The monsoon's middle thins and its tail fattens. That is a model suggestion worth watching, not a verdict about every future season.
Watch the calendar, not only the total
At Tadoba, the timing of the rain matters as much as the annual sum. When the green comes up, how long the pools hold, how slowly the land dries into April and May: those things decide how the forest presents itself.
The pool geography that makes Tadoba readable in the hot season could shift if the calendar shifts. That does not predict tiger numbers or sighting rates. A dry year will remain every bit as real as a wet one. It simply means that two years with the same annual rainfall may not make the same forest.
The recent gentleness looks more like a wet interval than evidence of a lasting shift. The warming background remains constant, and the models put harsher summer heat on top of it. The rain may not diminish overall, but it will likely arrive on a less forgiving schedule.
To explore the complete 50-year dataset, examine the daily anomalies, or download the raw JSON models, visit our interactive climate page.
Plan your visit around the forest, not the forecast
We start every stay with what the water and the green are doing that season, and we will tell you the same in a wet year or a dry one. Start the Conversation →
More Interesting Reads
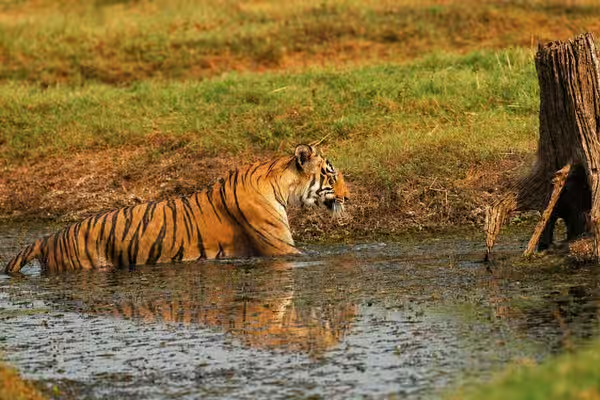
Most Indian Reserves Hide Their Tigers. Why Tadoba Can't.
Tadoba's tiger density is a fraction of Corbett's, yet sighting rates rank among India's highest. The gap between those facts is the real story.
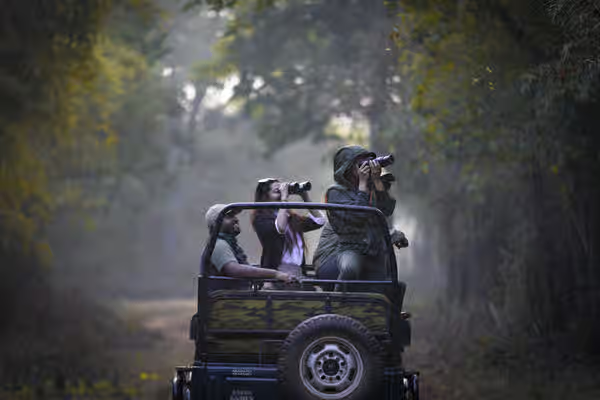
Where to See Tigers in India: Why We Picked These 16 Parks
Where are you most likely to see a real tiger in the wild? Sixteen parks matter for that question. How we chose them, and why Tadoba is the measure.

Core or Buffer Zone? What We Tell Our Guests
The hierarchy of core over buffer is one of the most persistent myths in Indian safari planning. Here is what actually matters.
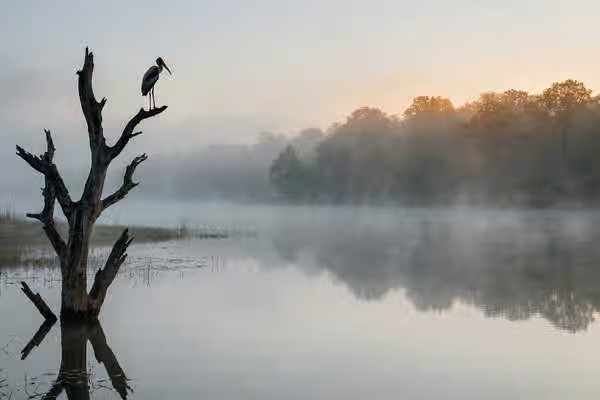
The Birding Safari at Tadoba: Why It Deserves a Trip of Its Own
Over 280 documented species in an IBA-designated forest, and mornings with nothing to do with tigers. Central India's most overlooked wildlife experience.
Tadoba Safari Gates: Where You Stay Changes Everything
Tadoba is larger than Greater London, yet most resorts sit by one gate. Where you stay decides your alarm, your drive, and what a 3-hour safari costs.
Tuning In: Why You Should Read Tadoba With Your Ears
Most guests arrive waiting to see the wildlife. The real secret is learning how to listen to it, especially after dark.

Two Full Bathrooms in Every Room? Why It Matters
Nobody should queue at 5am while the jeep waits outside. Why details like two full bathrooms matter, learned the hard way.
Services & Guides
Five safari types bookable with Limban right now - headache free. Take your pick.
Jeep, canter and full-day routes across every gate, arranged end to end by our own team.
Your Tadoba Guide: History, Climate, Zones, Wildlife, Best Time to Visit and Handy Tips
Everything worth knowing about the reserve, kept current season by season by the Limban team.
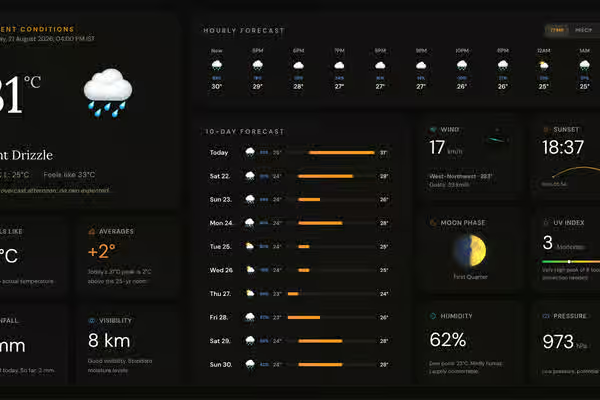
Live Weather Conditions, Accurate and Up-to-date 10-day Forecast for the Moharli Corridor.
Hourly forecasts, a ten-day outlook and safari-condition readouts, refreshed through the day.